Kali Purple SOC: Part 5 – Installing and Configuring Metricbeat


Installing Metricbeat
SSH Into Kali Purple VM
Download Metricbeat
curl -L -O https://artifacts.elastic.co/downloads/beats/metricbeat/metricbeat-8.6.1-amd64.debsudo dpkg -i metricbeat-8.6.1-amd64.deb
Modify /etc/metricbeat/metricbeat.yml to set the connection information
sudo nano /etc/metricbeat/metricbeat.yml
for setup.kibana
host: "https://192.168.253.6"
  setup.kibana.ssl.enabled: true
  ssl.certificate_authorities: ["/etc/kibana/kibana-server_ca.crt"]
  setup.kibana.ssl.certificate: "/etc/kibana/kibana-server.crt"
  setup.kibana.ssl.key: "/etc/kibana/kibana-server.key"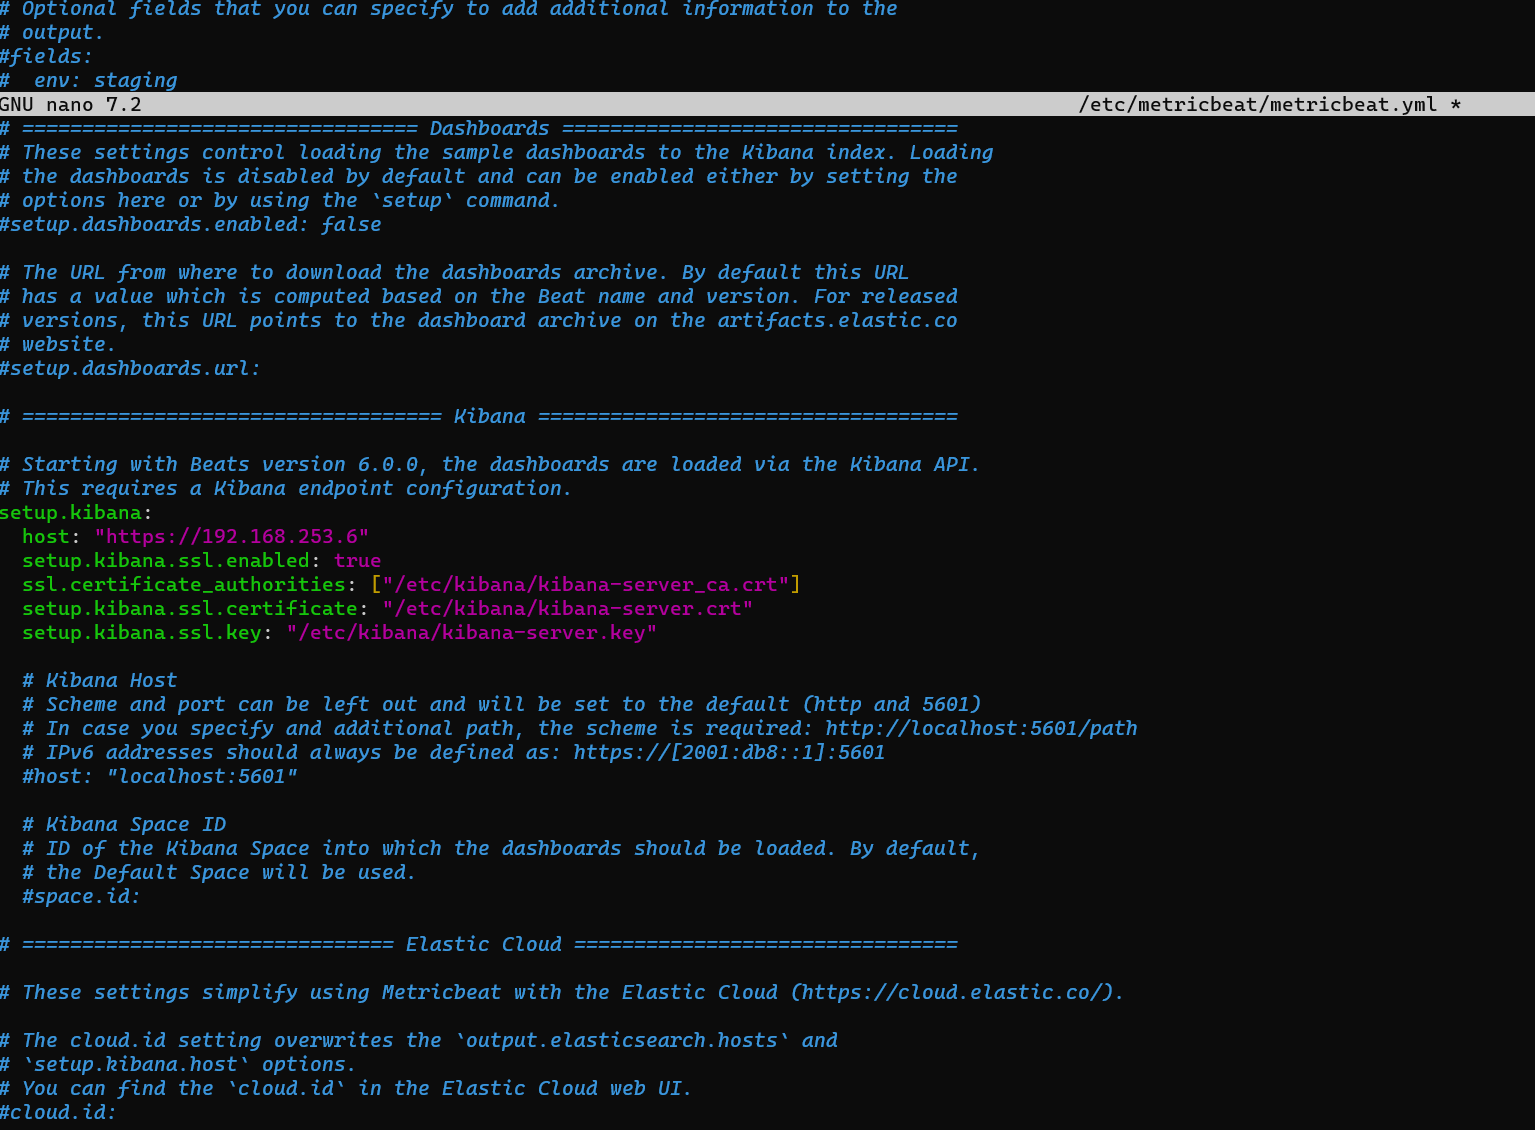
for output.elasticsearch
hosts: ["https://192.168.253.6"]
  username: "elastic"
  password: "<your_password>"
  # If using Elasticsearch's default certificate
  ssl.ca_trusted_fingerprint: "<your_cert_fingerprint>"
To find the es cert fingerprint, open another terminal window and input this command:
sudo openssl x509 -fingerprint -sha256 -noout -in /etc/elasticsearch/certs/http_ca.crt | awk 'BEGIN { FS = "=" } ; { print $2 }' | sed 's/://g'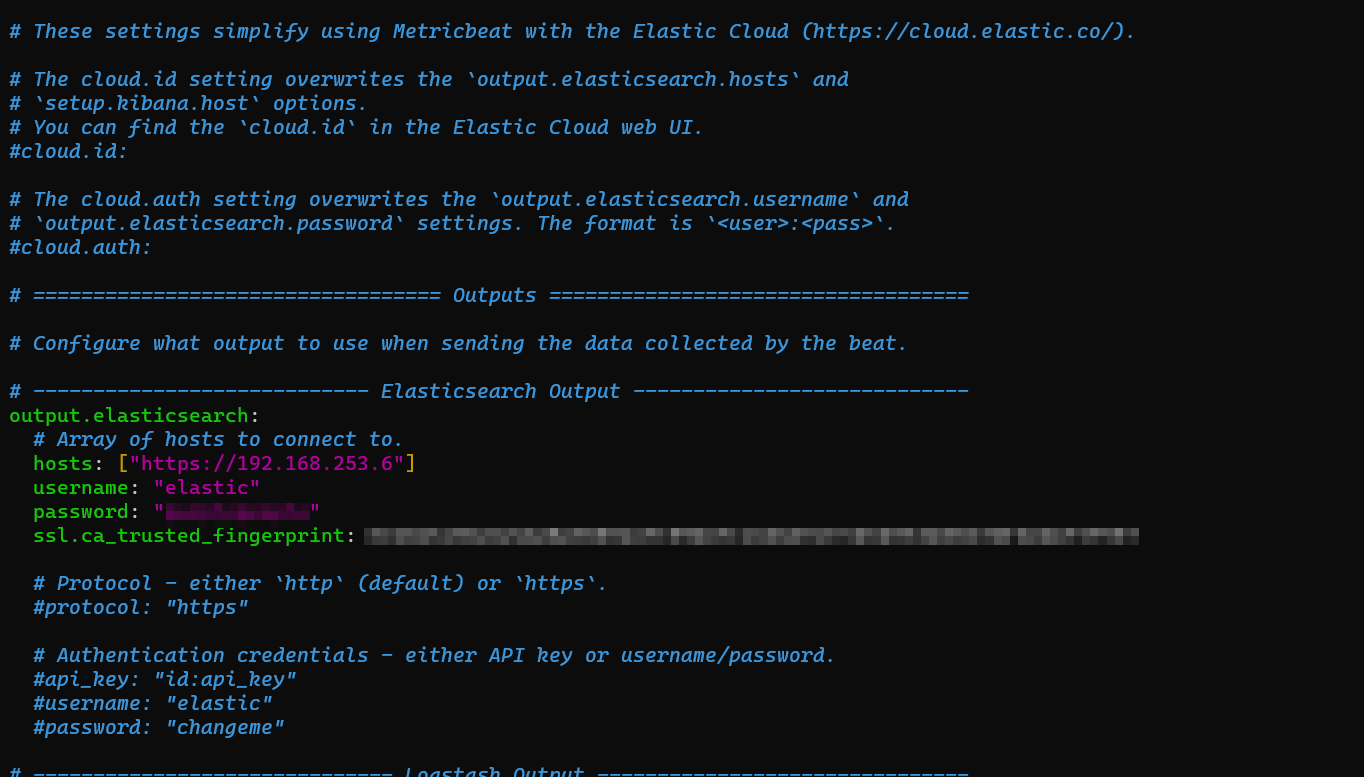
Enable and configure Elasticsearch module
sudo metricbeat modules enable elasticsearch
sudo nano /etc/metricbeat/modules.d/elasticsearch.yml
file should read:
# Module: elasticsearch
# Docs: https://www.elastic.co/guide/en/beats/metricbeat/main/metricbeat-module-elasticsearch.html

- module: elasticsearch
  #metricsets:
  #  - node
  #  - node_stats
  period: 10s
  hosts: ["https://192.168.253.6:9200"]
  username: "elastic"
  password: "<your_password>"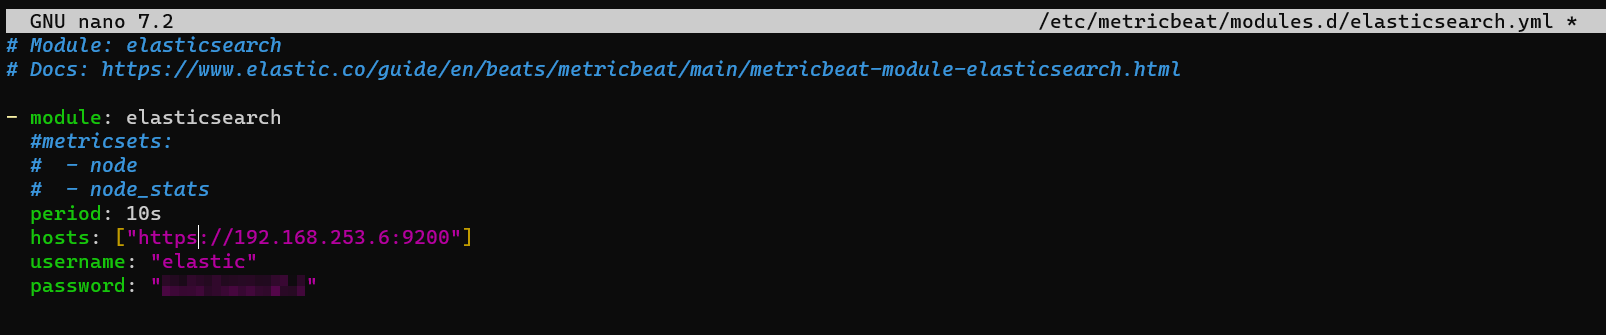
Enable and configure the elasticsearch-xpack module
sudo metricbeat modules enable elasticsearch-xpack
sudo nano /etc/metricbeat/modules.d/elasticsearch-xpack.yml
hosts: ["https://192.168.253.6:9200"]
  protocol: "https"
  username: "elastic"
  password: "<your_password>"
  ssl:
    enabled: true
    ca_trusted_fingerprint: "<es_cert_fingerprint>"
    verification_mode: "certificate"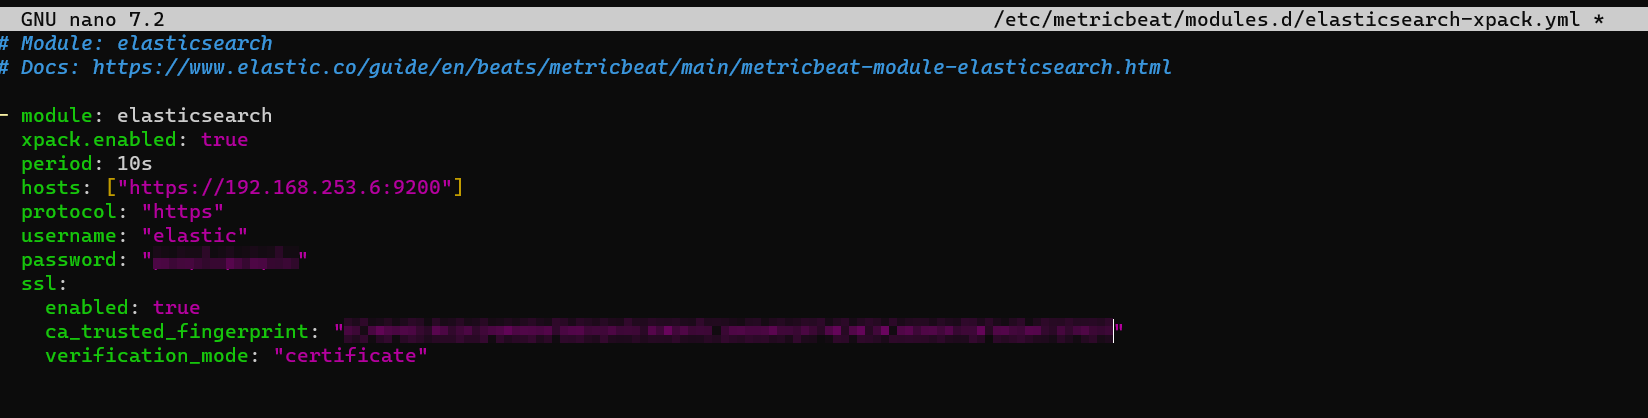
Start Metricbeat (this will take a few minutes)
sudo metricbeat test config
sudo metricbeat test modules
sudo metricbeat setup
sudo systemctl enable metricbeat --now
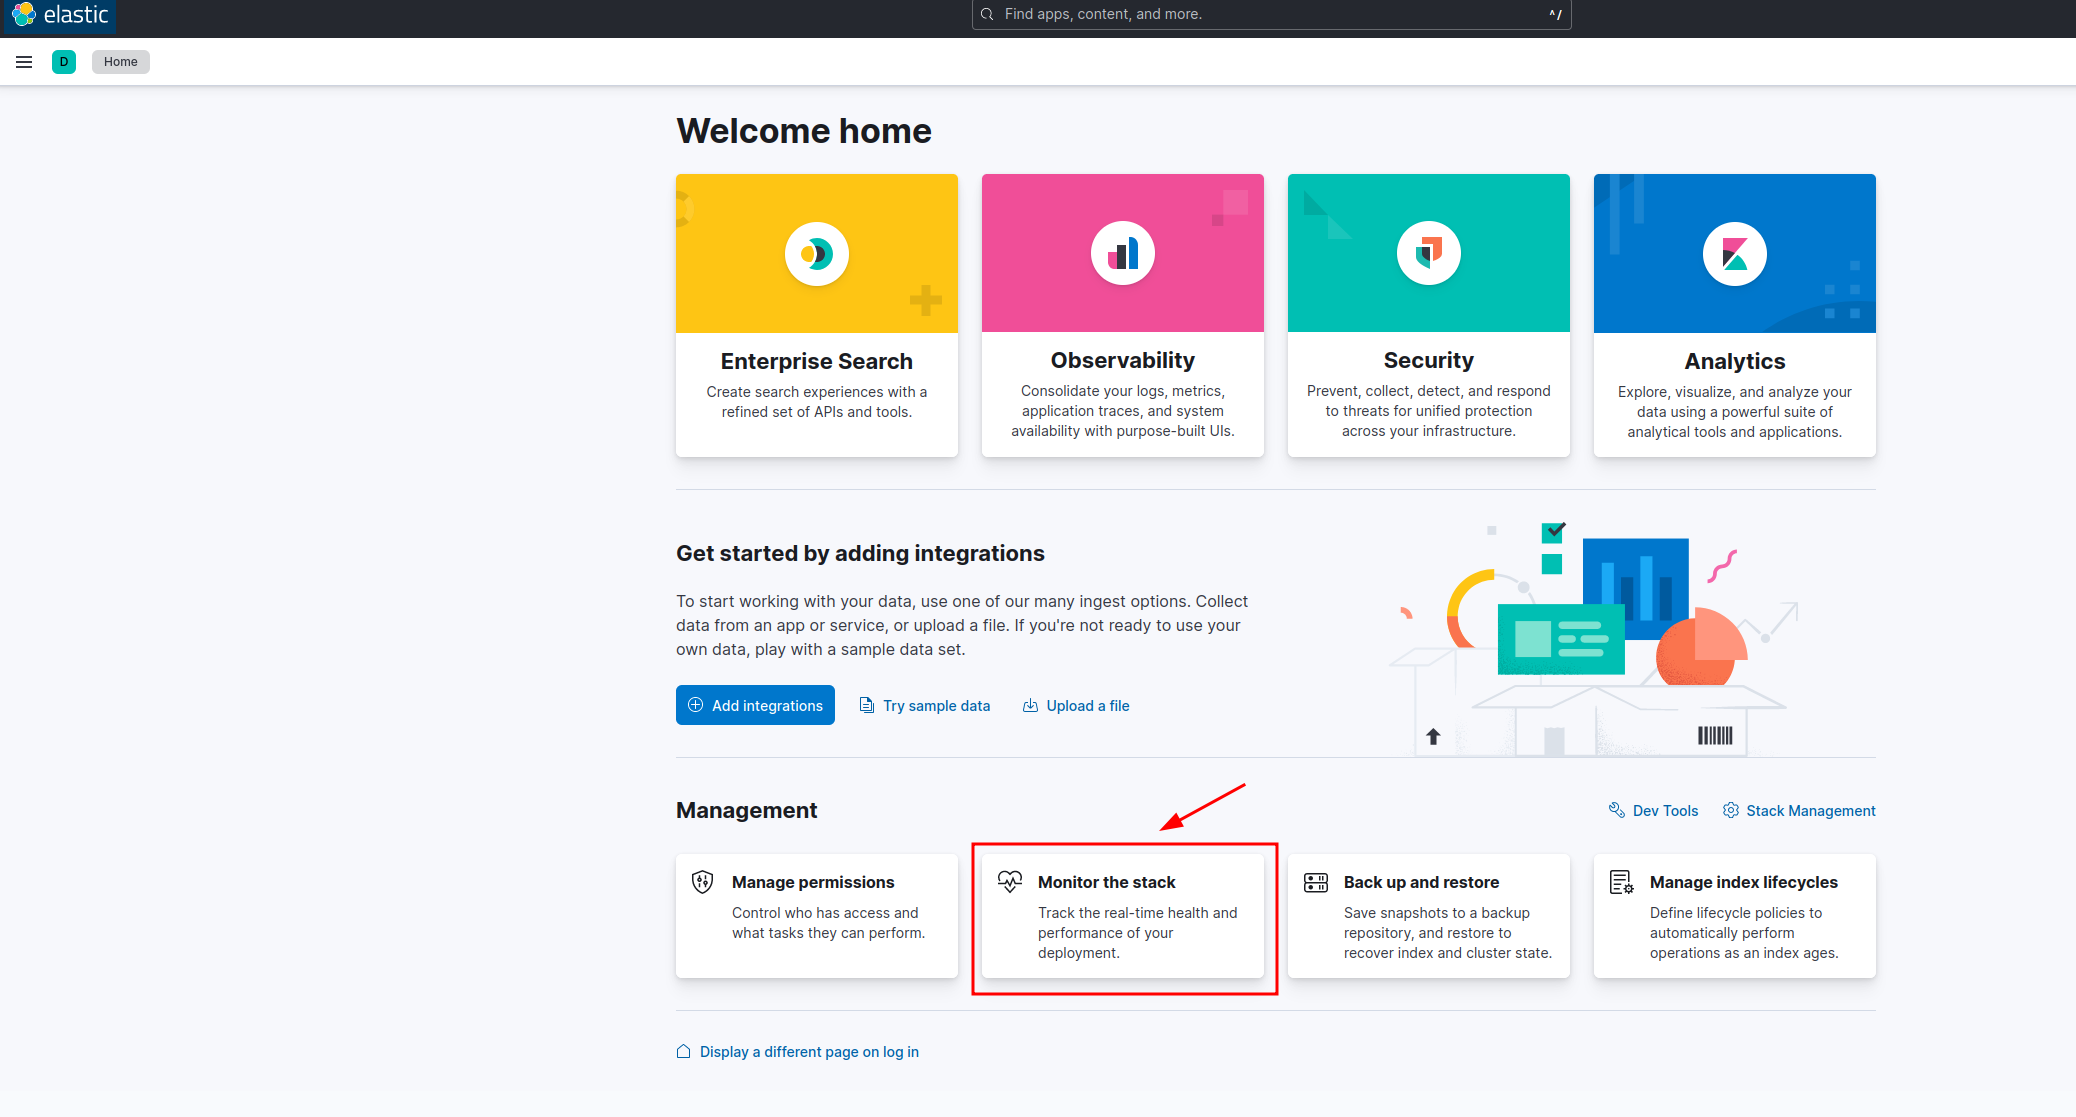
Go to the Elastic dashboard
Click Monitor the stack.
Click Ok

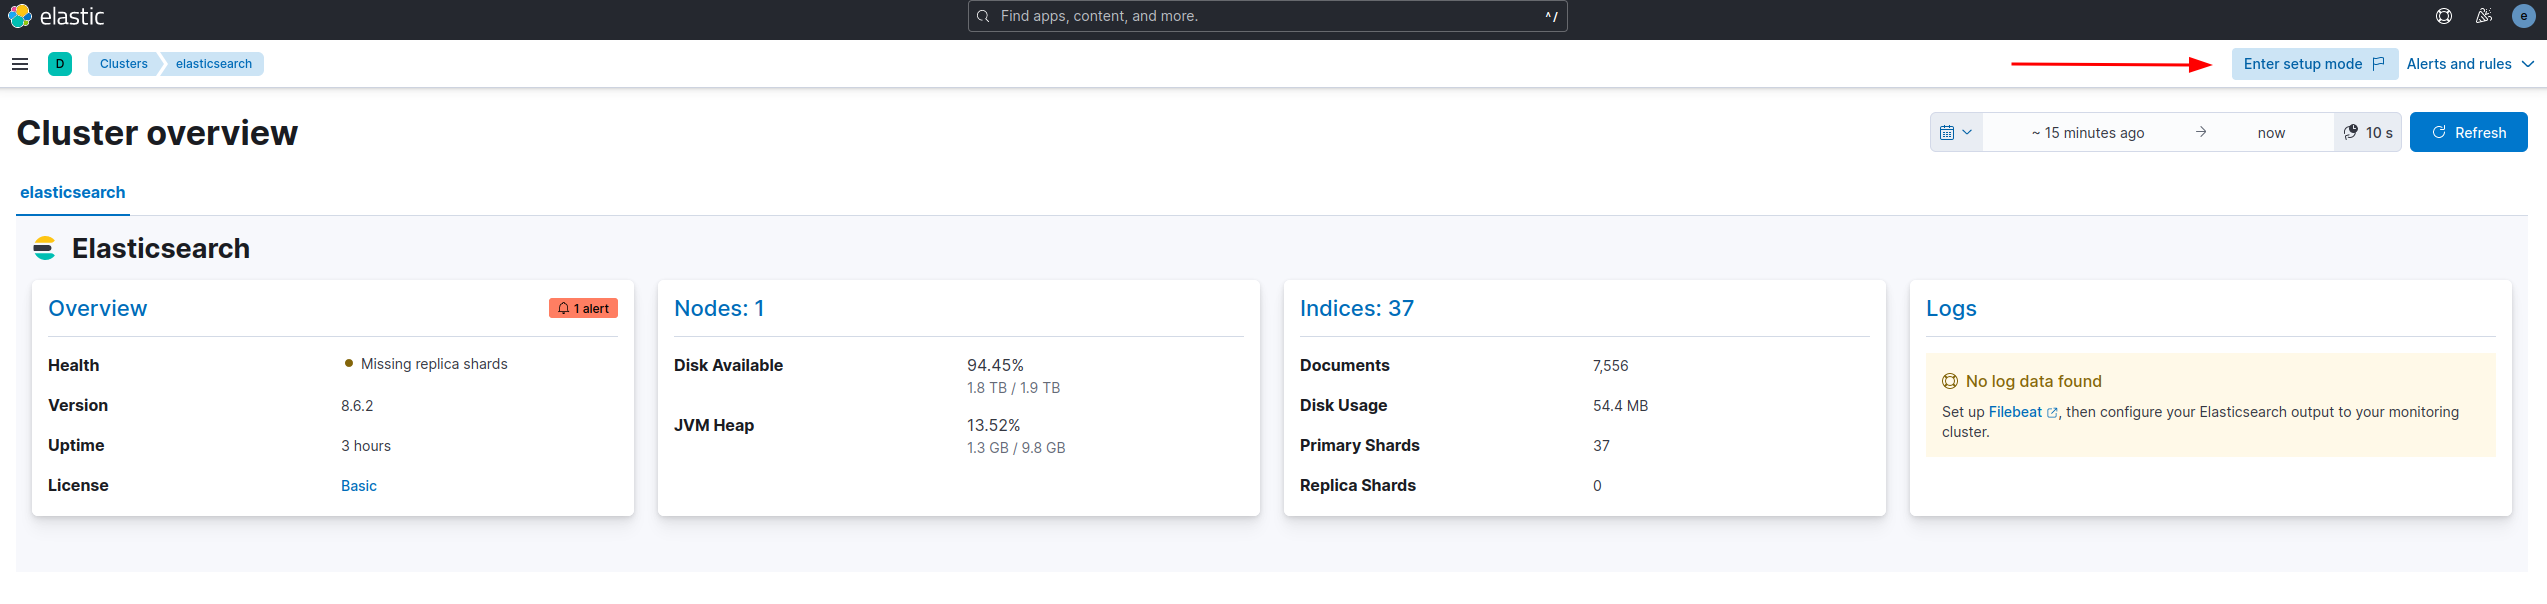
Click Enter setup mode
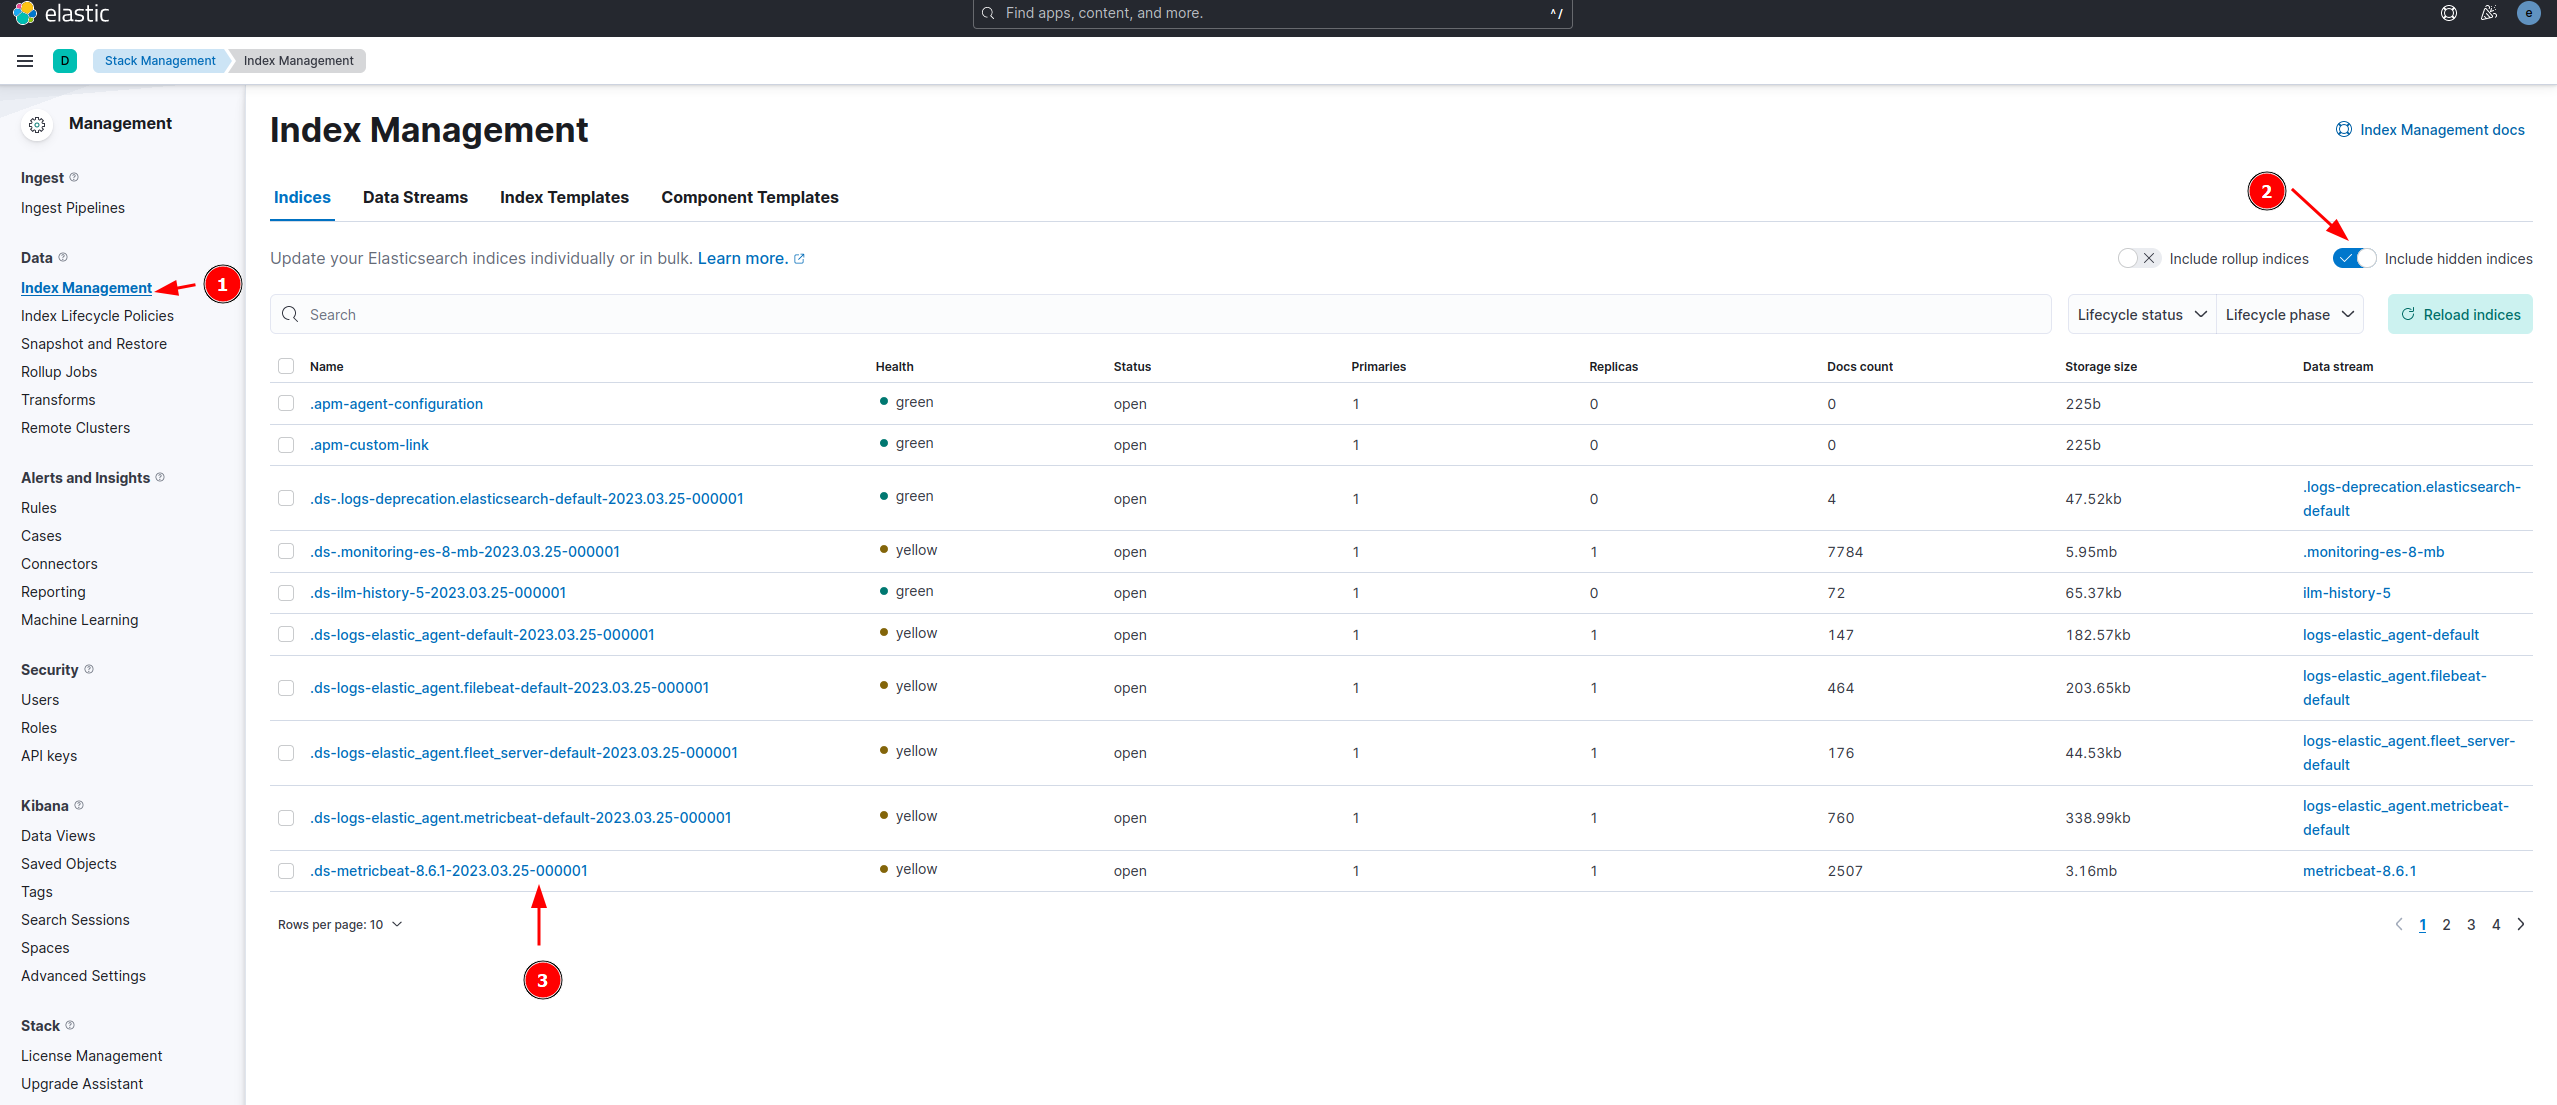
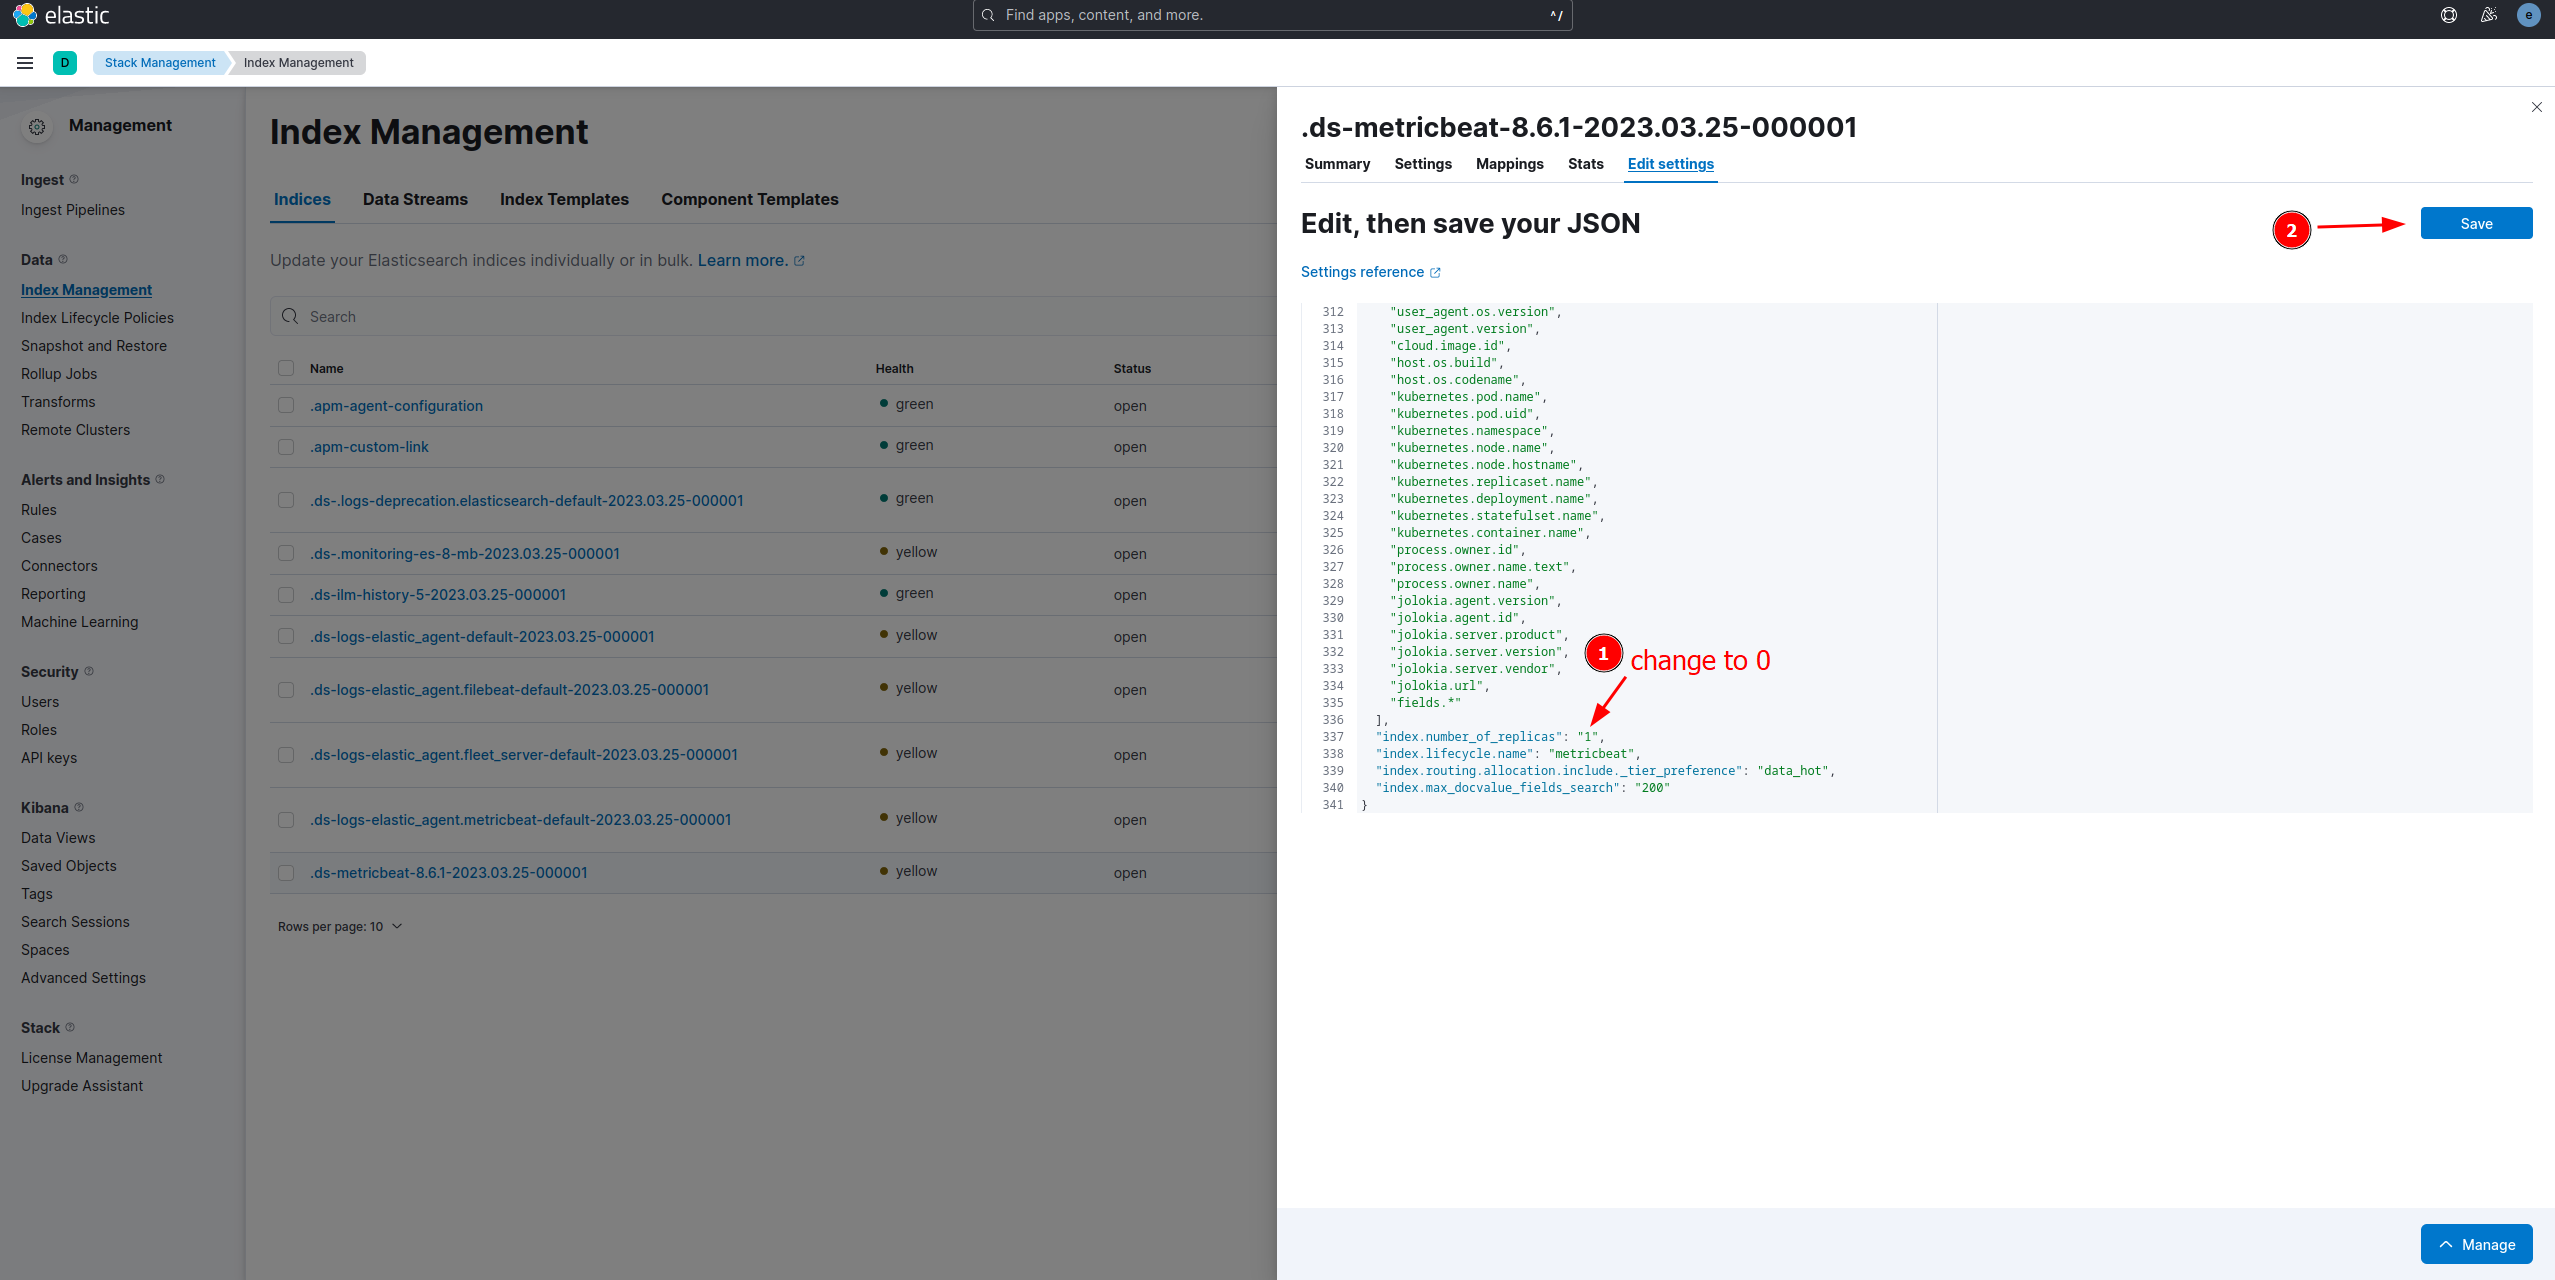
Click Stack Management
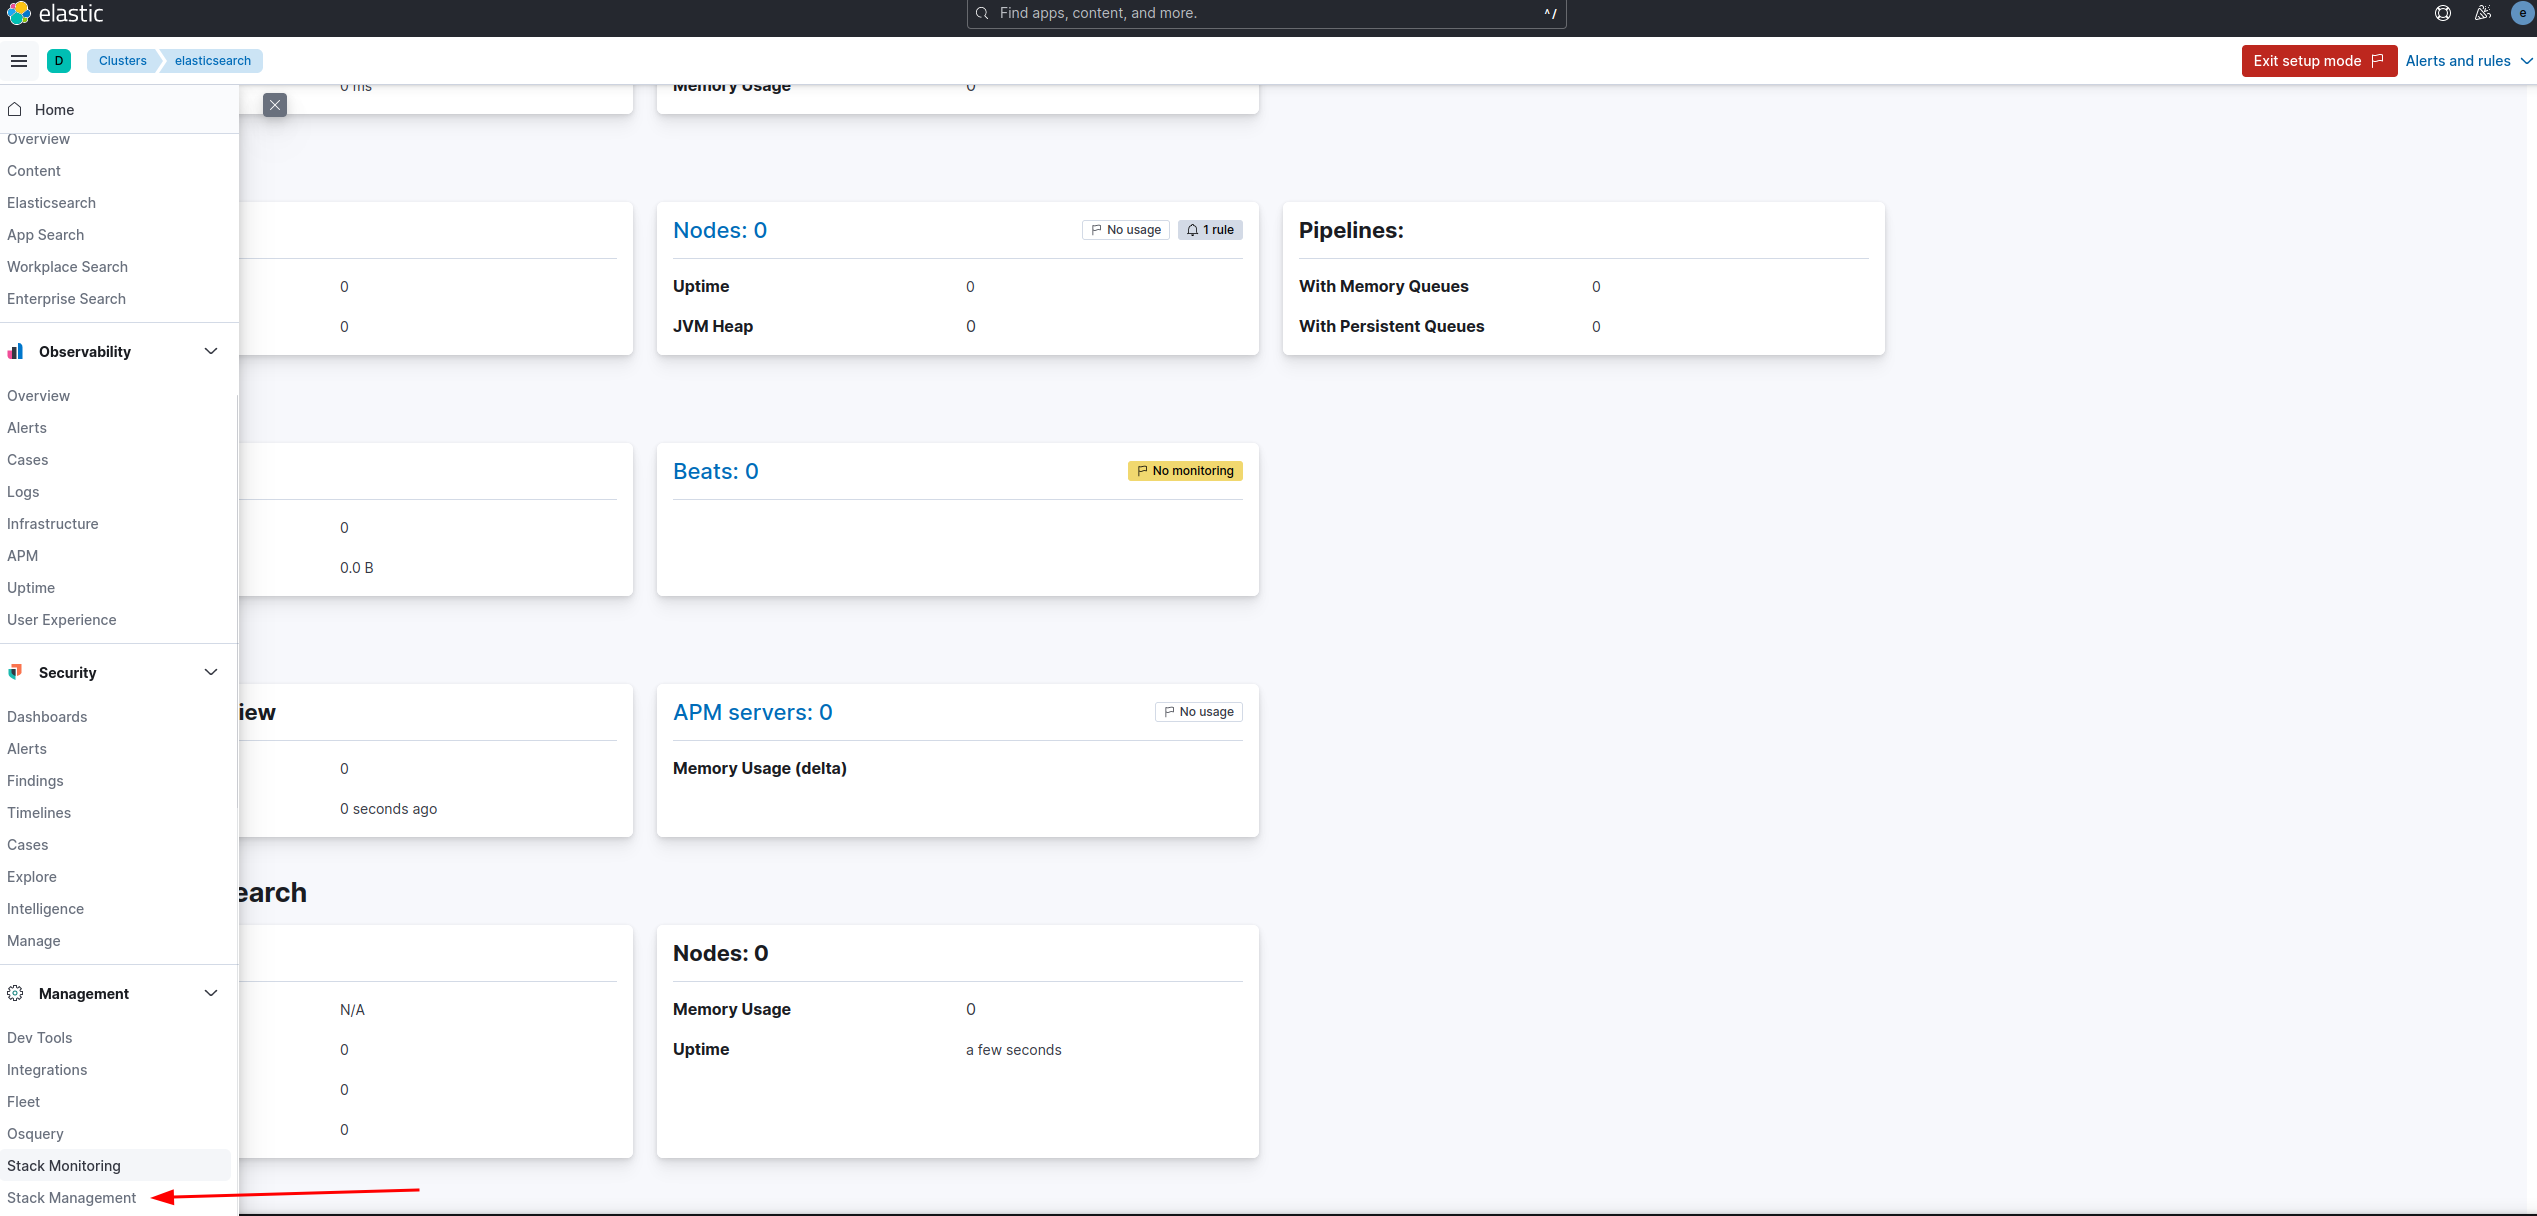
Follow the instructions in the screenshot below.